


| Surgeon Name | GMC Code | Surgeon’s Activity |
|---|---|---|
| Hasan Ahmed | 4390130 | H S |
| Wisam Isam Abdulamir Al-Hakim | 6031336 | H E S |
| Edward Cuthbert Andrews | 4384199 | H K |
| Nicholas Arestides Aresti | 7021132 | H E S |
| Homa Arshad | 4673042 | H K |
| Matthew Nicholas Bence | 7281048 | H K |
| Rejpaul Bhumbra | 6028717 | H K |
| Adrian Carlos | 4306267 | H E S |
| Sebastian Dawson-Bowling | 4736143 | H K |
| Claire Elaine Fitzgerald | 6074850 | H E S |
| Ian Roy Cuckow Garnham | 3322321 | H |
| Xavier Griffin | 6055402 | H |
| Zakir Naseem Haider | 7410062 | H A |
| Luckshmana Adrian Jeyaseelan | 6164291 | H A |
| Arif Ahmad Khan | 4492135 | H |
| Mandeep Lamba | 4076494 | H K |
| Joshua Lee | 4629696 | H K |
| Paul Tee Hui Lee | 5199546 | H K |
| Steven Millington | 4533096 | H K |
| William Nabulyato | 7130979 | H K S |
| Benignus Okafor | 3251153 | H |
| Joshua Chong Yew Ong | 6093509 | H |
| Amit Suresh Patel | 7021314 | H A |
| Jaison Patel | 7271986 | H K |
| Mahesh Pimple | 5209213 | H E S |
| Sameer Singh Rathore | 7638381 | H K |
| Kesavan Richard Sri-Ram | 4729170 | H K |
| Dhanasekaraprabu Trichy Balasubramanian | 7632246 | H |
| Konstantinos Tsitskaris | 6108953 | H K |
| Jonnie Richard Niall Ward | 6149027 | H K |
| Daniel Williams | 6156647 | H E S |
| Key : | |
|---|---|
| H | Hip surgery |
| K | Knee surgery |
| A | Ankle surgery |
| E | Elbow surgery |
| S | Shoulder surgery |

| Operation Type | Operation Subcategory | Procedures Recorded for this Hospital | National Average |
|---|---|---|---|
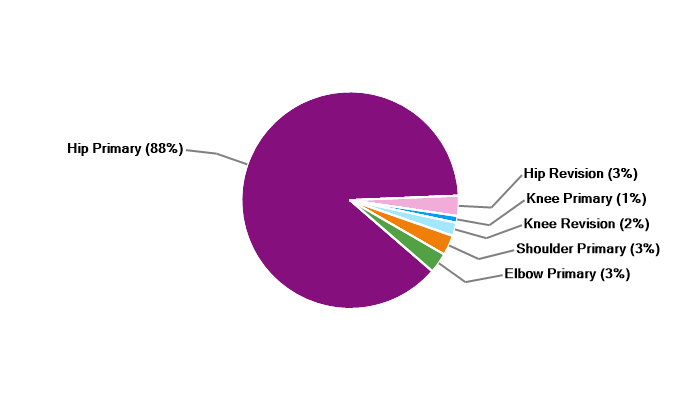
| Hip Primary | Total hip replacement | 22 | 294 |
| Hip Primary | Hip hemiarthroplasty | 236 | 163 |
| Hip Revision | - | 24 | 23 |
| Knee Primary | Total knee replacement | Fewer Than 5 | 302 |
| Knee Revision | - | 11 | 18 |
| Elbow Primary | - | 8 | 6 |
| Shoulder Primary | - | 17 | 30 |
| Total | 318+ | 836 |

| Operation Type | Operation Subcategory | Procedures Recorded for this Hospital | National Average |
|---|---|---|---|
| Hip Primary | Hip hemiarthroplasty | 732 | 373 |
| Hip Revision | - | 66 | 63 |
| Hip Primary | Total hip replacement | 58 | 868 |
| Knee Primary | Total knee replacement | 10 | 852 |
| Knee Revision | - | 29 | 51 |
| Elbow Revision | - | Fewer Than 5 | 6 |
| Elbow Primary | - | 24 | 14 |
| Shoulder Revision | - | Fewer Than 5 | 9 |
| Shoulder Primary | - | 34 | 81 |
| Total | 953+ | 2317 |
This information display shows you how this hospital compares to the national rates for a range of patient outcomes measures used to demonstrate quality in joint replacement surgery. Against each measure you will be able to see whether this hospital is performing better than expected, within the expected range, or worse than expected for this type of surgery. This hospital is represented on the chart by a red triangle.
It is important to note that the types of patients a hospital treats and the procedures it carries out can explain variation in patient outcomes after surgery. Please click on the “How to interpret this chart” button for further information.
Patient outcomes, featured in this second chart below, looks at mortality and revision. Please click on the “How to interpret this chart” button for further information including additional notes on factors that may affect the results shown including whether the hospital is providing a full and accurate submission of first-time joint replacement and revision operation data to the NJR.
Data for February 2016 - February 2026
 to find out more about the quality measure and its source data
| Patient Outcomes Quality Measure | This Hospital | Patient Records Analysed | This Hospital Ratio | National Ratio | 0
1
2
3
4
5
|
|---|---|---|---|---|---|
| 90 Day Mortality: Operations February 2021 - February 2026 |  Inside control limits Inside control limits | 12 | 0.91 | 1.00 |
|
| Revision Rate: Operations February 2016 - February 2026 | Inside control limits | 498 | 1.21 | 1.00 |
|
| Revision Rate: Operations February 2021 - February 2026 | Inside control limits | 93 | 1.54 | 1.00 |
|
This information display shows overall characteristics for first-time hip replacement patients treated at this hospital between 1 April 2003 and 31 March 2026. Against each characteristic you will be able to see whether this hospital has treated a greater or fewer number of patients of a particular type. This hospital is represented on the chart by the black marker ( ).
).
The types of patients a hospital treats can explain variation in patient outcomes after surgery. Please click on the “How to interpret this chart” button for further information.
For hospitals in England and Wales, the NJR has collected information since 2003. For Northern Ireland since 2013, for the Isle of Man since 2015, for Guernsey since 2019 and for Jersey since 2025.Data for 1 April 2003 - 31 March 2026
to find out more about the quality measure and its source data
| Percentage Of Patients Who Were: | This Hospital | National Average | |
|---|---|---|---|
| Male | 36% | 40% |
|
| Under 60 years of age | 14% | 20% |
|
| Severely Obese (BMI of 35 or greater) | 10% | 13% |
|
| At higher risk of medical problems before or after Surgery (ASA 3+) | 47% | 22% |
|
| Diagnosed with conditions other than Osteoarthritis | 40% | 14% |
|
| NHS-funded | 100% | 81% |
|
This information display shows you how this hospital compares to the national rates for a range of patient outcomes measures used to demonstrate quality in joint replacement surgery. Against each measure you will be able to see whether this hospital is performing better than expected, within the expected range, or worse than expected for this type of surgery. This hospital is represented on the chart by a red triangle.
It is important to note that the types of patients a hospital treats and the procedures it carries out can explain variation in patient outcomes after surgery. Please click on the “How to interpret this chart” button for further information.
Patient outcomes, featured in this second chart below, looks at mortality and revision. Please click on the “How to interpret this chart” button for further information including additional notes on factors that may affect the results shown including whether the hospital is providing a full and accurate submission of first-time joint replacement and revision operation data to the NJR.
Data for February 2016 - February 2026
to find out more about the quality measure and its source data
| Patient Outcomes Quality Measure | This Hospital | Patient Records Analysed | This Hospital Ratio | National Ratio | 0
1
2
3
4
5
|
|---|---|---|---|---|---|
| 90 Day Mortality: Operations February 2021 - February 2026 | Inside control limits | Fewer Than 5 | 0.98 | 1.00 |
|
| Revision Rate All Knees: Operations February 2016 - February 2026 | Inside control limits | 532 | 0.90 | 1.00 |
|
| Revision Rate Total Knee replacement: Operations February 2016 - February 2026 | Inside control limits | 530 | 1.00 | 1.00 |
|
| Revision Rate Unicondylar Knees: Operations February 2016 - February 2026 | Inside control limits | Fewer Than 5 | 0.93 | 1.00 |
|
| Revision Rate: Operations February 2021 - February 2026 | Inside control limits | 10 | 0.90 | 1.00 |
|
This information display shows overall characteristics for first-time knee replacement patients treated at this hospital between 1 April 2003 and 31 March 2026. Against each characteristic you will be able to see whether this hospital has treated a greater or fewer number of patients of a particular type. This hospital is represented on the chart by the black marker ().
The types of patients a hospital treats can explain variation in patient outcomes after surgery.
For hospitals in England and Wales, the NJR has collected information since 2003. For Northern Ireland since 2013, for the Isle of Man since 2015, for Guernsey since 2019 and for Jersey since 2025.
Please click on the “How to interpret this chart” button for further information.
Data for 1 April 2003 - 31 March 2026
to find out more about the quality measure and its source data
| Percentage Of Patients Who Were: | This Hospital | National Average | |
|---|---|---|---|
| Male | 36% | 44% |
|
| Under 60 years of age | 14% | 16% |
|
| Severely Obese (BMI of 35 or greater) | 30% | 23% |
|
| At higher risk of medical problems before or after Surgery (ASA 3+) | 24% | 19% |
|
| Diagnosed with conditions other than Osteoarthritis | 1% | 4% |
|
| NHS-funded | 99% | 84% |
|
This information display shows overall characteristics for first-time elbow replacement patients treated at this hospital between 1 April 2012 and 31 March 2026. Against each characteristic you will be able to see whether this hospital has treated a greater or fewer number of patients of a particular type. This hospital is represented on the chart by the black marker ().
The types of patients a hospital treats can explain variation in patient outcomes after surgery.
Note: Data submission for Northern Ireland hospitals started in February 2013, for the Isle of Man in July 2015, for Guernsey in November 2019 and for Jersey since 2025.
Note: BMI data submission for Elbows started in June 2018.
Please click on the How to interpret this chart button for further information.
Data for 1 April 2012 - 31 March 2026
to find out more about the quality measure and its source data
| Percentage Of Patients Who Were: | This Hospital | National Average | |
|---|---|---|---|
| Male | 47% | 33% |
|
| Under 60 years of age | 47% | 39% |
|
| Severely Obese (BMI of 35 or greater) | 20% | 18% |
|
| At higher risk of medical problems before or after Surgery (ASA 3+) | 24% | 28% |
|
| Diagnosed with conditions other than Osteoarthritis | 100% | 88% |
|
| NHS-funded | 100% | 97% |
|
This information display shows overall characteristics for first-time shoulder replacement patients treated at this hospital between 1 April 2012 and 31 March 2026. Against each characteristic you will be able to see whether this hospital has treated a greater or fewer number of patients of a particular type. This hospital is represented on the chart by the black marker ().
The types of patients a hospital treats can explain variation in patient outcomes after surgery.
Note: Data submission for Northern Ireland hospitals started in February 2013, for the Isle of Man in July 2015, for Guernsey in November 2019 and for Jersey since 2025.
Note: BMI data submission for Elbows started in June 2018.
Please click on the How to interpret this chart button for further information.
Data for 1 April 2012 - 31 March 2026
to find out more about the quality measure and its source data
| Percentage Of Patients Who Were: | This Hospital | National Average | |
|---|---|---|---|
| Male | 21% | 31% |
|
| Under 60 years of age | 4% | 11% |
|
| Severely Obese (BMI of 35 or greater) | 11% | 18% |
|
| At higher risk of medical problems before or after Surgery (ASA 3+) | 40% | 33% |
|
| Diagnosed with conditions other than Osteoarthritis | 77% | 48% |
|
| NHS-funded | 100% | 89% |
|
This information display shows whether this hospital is submitting all the data they should to the NJR (compliance), whether those records have corresponding patient details (patient consent) and whether the records have a valid NHS or national patient number. This is important so that the NJR can measure how long implants last and look at other areas of surgical performance.
The display also shows a result for data entry delay. This indicates whether the hospital is submitting their information in a timely way. This is important so that the NJR can report an accurate and full picture of performance to hospitals, the surgeons who work there as well as to patients and the public.
This hospital is represented on the chart by the black marker (). Please click on the “How to interpret this chart” button for further information.
Compliance data for 1 January 2025 – 31 December 2025
All other data for 1 April 2025 – 31 March 2026
to find out more about the quality measure and its source data
| Quality Measure | This Hospital | National Expected | ||
|---|---|---|---|---|
| Compliance (for the Trust) |  Better Than Expected Better Than Expected | 100.0% | 95.0% |
|
| Revision Compliance (for the Trust) | Better Than Expected | 100.0% | 95.0% |
|
| Trauma consent rate | As Expected | 88.5% | 90.0% |
|
| Elective consent rate | As Expected | 77.1% | 90.0% |
|
| Valid NHS number | Better Than Expected | 98.8% | 95.0% |
|
| Time taken to enter data | As Expected | 17 Days | 30 Days |
|
