




|
|
| Pinderfields General Hospital |
 |
| Pontefract Elective Unit (Treatment Centre) |
|
| Spire Elland Hospital |
|
| Spire Methley Park Hospital |
|
| Operation Type | Operation Subcategory | Procedures Recorded for this Surgeon | National Average |
|---|---|---|---|
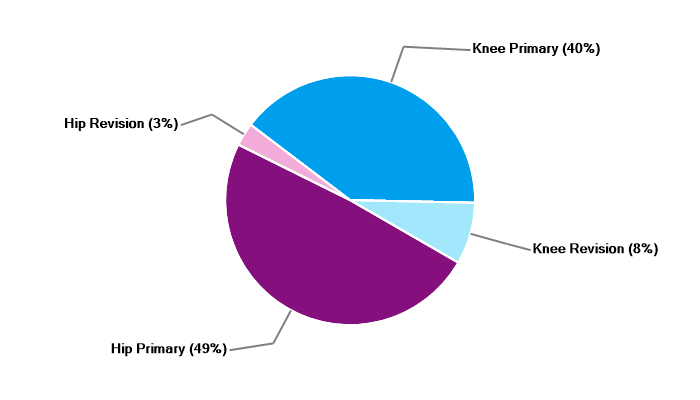
| Hip Primary | Hip hemiarthroplasty | 20 | 13 |
| Hip Primary | Total hip replacement | 136 | 67 |
| Hip Revision | As CIC | 8 | 7 |
| Hip Revision | As Dual consultant | Fewer Than 5 | 2 |
| Knee Primary | Total knee replacement | 119 | 67 |
| Knee Revision | As CIC | 16 | 7 |
| Knee Revision | As Dual consultant | 6 | 2 |
| Total | - | 305+ | 165 |
| Time from first procedure submitted to the NJR as Consultant in Charge | More than 36 months |
| Operation Type | Operation Subcategory | Procedures Recorded for this Surgeon | National Average |
|---|---|---|---|
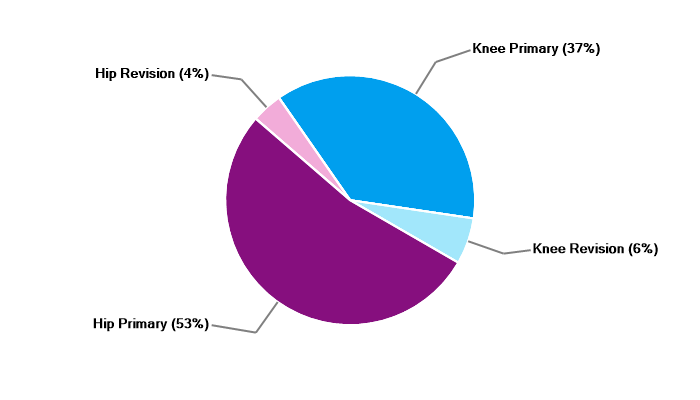
| Hip Primary | Hip hemiarthroplasty | 50 | 30 |
| Hip Primary | Total hip replacement | 391 | 165 |
| Hip Revision | As CIC | 35 | 16 |
| Hip Revision | As Dual consultant | 15 | 3 |
| Knee Primary | Total knee replacement | 356 | 184 |
| Knee Revision | As CIC | 58 | 15 |
| Knee Revision | As Dual consultant | 23 | 3 |
| Total | - | 928 | 416 |
| Time from first procedure submitted to the NJR as Consultant in Charge | More than 36 months |

This information display shows overall characteristics for first-time hip replacement patients treated by this surgeon between 1 April 2003 and 31 March 2026. Against each characteristic you will be able to see whether this surgeon has been responsible for a greater or fewer number of patients of a particular type. This surgeon is represented on the chart by the black marker ( ).
).
The types of patients a surgeon treats can explain variation in patient outcomes after surgery. Please click on the “How to interpret this chart” button for further information.
For surgeons in England and Wales, the NJR has collected information since 2003. For surgeons in Northern Ireland since February 2013, for surgeons in the Isle of Man since July 2015, for surgeons in Guernsey since November 2019 and for surgeons in Jersey since 2025.
Data for 1 April 2003 - 31 March 2026
 to find out more about the quality measure and its source data
| Percentage Of Patients Who Were: | This Surgeon | National Average | |
|---|---|---|---|
| Male | 37% | 40% |
|
| Under 60 years of age | 25% | 20% |
|
| Severely Obese (BMI of 35 or greater) | 18% | 13% |
|
| At higher risk of medical problems before or after Surgery (ASA 3+) | 29% | 22% |
|
| Diagnosed with conditions other than Osteoarthritis | 15% | 13% |
|
| NHS-funded | 87% | 81% |
|
What does this mean?
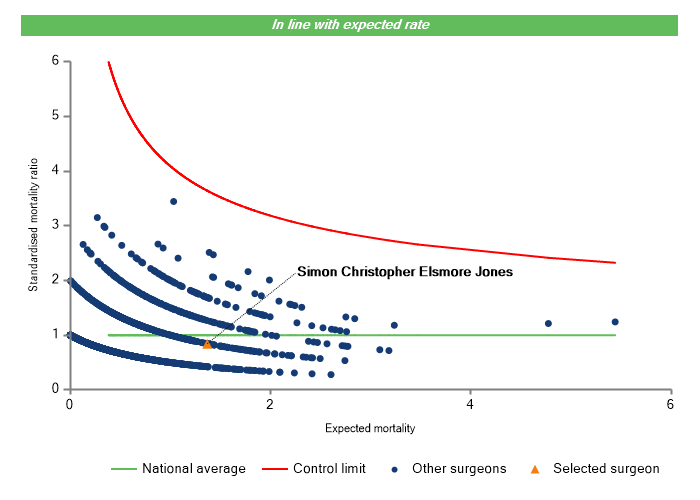
This shows 90-day mortality following hip surgery for this surgeon, based on the type of patients this surgeon has seen.
The surgeon you are reviewing is highlighted as an orange triangle. Progression along the horizontal axis (x axis) means that the surgeon has done more cases and/or cases at a higher mortality risk such as older patients. Progression along the vertical axis (y axis) means the surgeon has had more deaths.
The vertical axis figures are presented as a standardised mortality ratio. This means the values do not represent percentages of patients who have died, but they represent the proportion of deaths compared to the national average. The data is also risk adjusted to take account of the fact that different surgeons may operate on more higher-risk or lower-risk patients e.g. because of demographics in the patient population they work with.
This information display shows overall characteristics for first-time knee replacement patients treated by this surgeon between 1 April 2003 and 31 March 2026. Against each characteristic you will be able to see whether this surgeon has been responsible for a greater or fewer number of patients of a particular type. This surgeon is represented on the chart by the black marker ().
The types of patients a surgeon treats can explain variation in patient outcomes after surgery. Please click on the “How to interpret this chart” button for further information.
For surgeons in England and Wales, the NJR has collected information since 2003. For surgeons in Northern Ireland since February 2013, for surgeons in the Isle of Man since July 2015, for surgeons in Guernsey since November 2019 and for surgeons in Jersey since 2025.
Data for 1 April 2003 - 31 March 2026
to find out more about the quality measure and its source data
| Percentage Of Patients Who Were: | This Surgeon | National Average | |
|---|---|---|---|
| Male | 44% | 44% |
|
| Under 60 years of age | 18% | 16% |
|
| Severely Obese (BMI of 35 or greater) | 26% | 23% |
|
| At higher risk of medical problems before or after Surgery (ASA 3+) | 30% | 19% |
|
| Diagnosed with conditions other than Osteoarthritis | 5% | 3% |
|
| NHS-funded | 92% | 84% |
|
What does this mean?
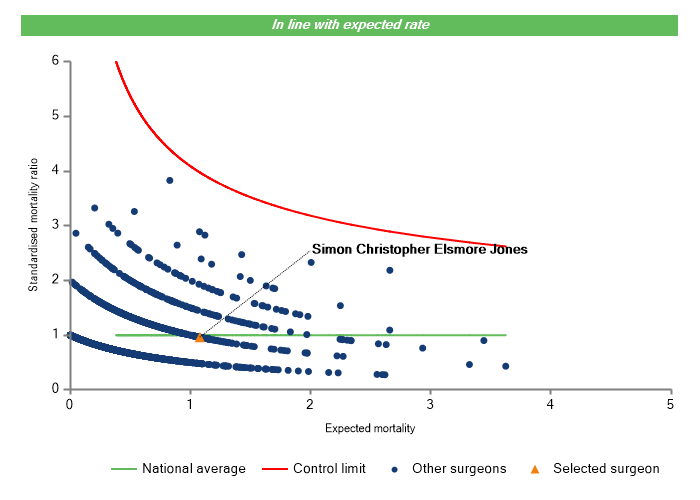
This shows 90-day mortality following knee surgery for this surgeon, based on the type of patients this surgeon has seen.
The surgeon you are reviewing is highlighted as an orange triangle. Progression along the horizontal axis (x axis) means that the surgeon has done more cases and/or cases at a higher mortality risk such as older patients. Progression along the vertical axis (y axis) means the surgeon has had more deaths.
The vertical axis figures are presented as a standardised mortality ratio. This means the values do not represent percentages of patients who have died, but they represent the proportion of deaths compared to the national average. The data is also risk adjusted to take account of the fact that different surgeons may operate on more higher-risk or lower-risk patients e.g. because of demographics in the patient population they work with.

